Delwedd:Ukrainian parliamentary election, 2007 (SwingByRegion).PNG

Ukrainian_parliamentary_election,_2007_(SwingByRegion).PNG((767 × 477 picsel, maint y ffeil: 16 KB, ffurf MIME: image/png))

Daw'r ffeil hon o Comin Wikimedia a gellir ei defnyddio gan brosiectau eraill. Dangosir isod y disgrifiad sydd ar dudalen ddisgrifio'r ffeil yno.

Crynodeb

Disgrifiad
Dyddiad
Ffynhonnell Self-made based off map by Muumi with data from Central Election Commission of Ukraine
Awdur User:DemocracyATwork
Caniatâd
(Ailddefnyddio'r ffeil hon)
w:en:Creative Commons
cydnabyddiaeth rhannu ar dermau tebyg
Trwyddedir y ffeil hon yn ôl termau'r drwydded Creative Commons Attribution-Share Alike 1.0 Generic.
Cydnabyddiaeth: DemocracyATwork
Mae'n rhydd i chi:
  • rhannu – gallwch gopïo, dosbarthu a throsglwyddo'r gwaith
  • ailwampio – gallwch addasu'r gwaith
Ar yr amodau canlynol:
  • cydnabyddiaeth – Mae'n rhaid i chi nodi manylion y gwaith hwn, rhoi dolen i'r drwydded, a nodi os y bu golygu arni, yn y modd a benwyd gan yr awdur neu'r trwyddedwr (ond heb awgrymu o gwbl eu bod yn eich cymeradwyo chi na'ch defnydd o'r gwaith).
  • rhannu ar dermau tebyg – If you alter, transform, or build upon this work, you must distribute the resulting work under the same license as the original.
Diwygiadau eraill

Collection

Results of the parliamentary elections:
Politcal alignment 2007
Vote percenatge 2006 to 2007 (Top Six parties)
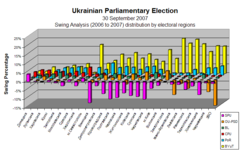
Swing 2006 to 2007 (Top Six parties)

Regional Analysis of the parliamentary elections:

Highest Vote per region
Charts showing the top six parties support - percentage of total national vote and Electoral Region
Vote Percentage by Electoral Region Vote Percentage by Electoral Region Swing by Electoral Regions
Maps showing the top six parties support - percentage of total national vote
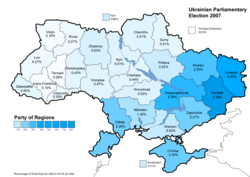
Party of Regions results (34.37%)
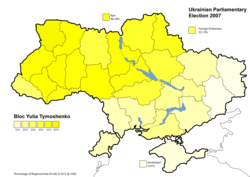
Bloc Yulia Tymoshenko results (30.71%
Our Ukraine People's Self-Defence results (14.15%)
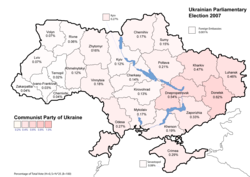
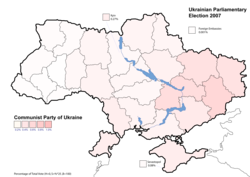
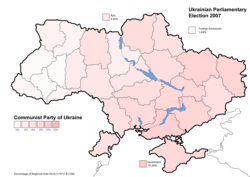
Communist Party of Ukraine results (5.39%)
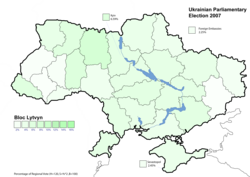
Bloc Lytvyn Party results (3.96%)
Socialist Party of Ukraine results (2.86%)
Maps showing the top six parties support - percentage of total national vote (Minimal text)
Party of Regions results (34.37%)
Bloc Yulia Tymoshenko results (30.71%
Our Ukraine People's Self-Defence results (14.15%)
Communist Party of Ukraine results (5.39%)
Bloc Lytvyn Party results (3.96%)
Socialist Party of Ukraine results (2.86%)
Maps showing the top six parties support - percentage per region
Party of Regions results (34.37%)
Bloc Yulia Tymoshenko results (30.71%
Our Ukraine People's Self-Defence results (14.15%)
Communist Party of Ukraine results (5.39%)
Bloc Lytvyn Party results (3.96%)
Socialist Party of Ukraine results (2.86%)


2007 [1] [2] [3] [4] [5] [6]

2006 [7] [8] [9] [10] [11] [12]

A swing analysis is common in any election. It shows the change in voter percentage for each party by regions from 2006 to 2007.

Trwyddedu

Public domain Yr wyf fi, deiliad hawlfraint y gwaith hwn, yn ei ryddhau i'r parth cyhoeddus, a hynny'n fyd-eang.
Hwyrach nad yw hyn yn bosib yn ôl cyfraith rhai gwledydd; os felly:
Rwyn rhoi i unrhywun yr hawl i ddefnyddio'r gwaith hwn at unrhyw ddiben, heb unrhyw amodau, oddieithr unrhyw amodau gofynnol yn ôl y gyfraith.
  1. Template:Cite gov
  2. Template:Cite gov
  3. Template:Cite gov
  4. Template:Cite gov
  5. Template:Cite gov
  6. Template:Cite gov
  7. Template:Cite gov
  8. Template:Cite gov
  9. Template:Cite gov
  10. Template:Cite gov
  11. Template:Cite gov
  12. Template:Cite gov

Captions

Add a one-line explanation of what this file represents

Items portrayed in this file

yn portreadu

11 Chwefror 2008

MIME type Saesneg

image/png

Hanes y ffeil

Cliciwch ar ddyddiad / amser i weld y ffeil fel ag yr oedd bryd hynny.

Dyddiad / AmserBawdlunHyd a lledDefnyddiwrSylw
cyfredol17:07, 20 Chwefror 2008Bawdlun y fersiwn am 17:07, 20 Chwefror 2008767 × 477 (16 KB)DemocracyATworkUkrainian Parliamentary Election 2007 Results of election (Political Swing by region) chart. Removed boarder.
23:10, 17 Chwefror 2008Bawdlun y fersiwn am 23:10, 17 Chwefror 2008748 × 477 (16 KB)DemocracyATworkUpdate to reflect color change for Bloc Lytvyn to match with the Parliamentary seat allocation map. From grey to geen.
14:24, 13 Chwefror 2008Bawdlun y fersiwn am 14:24, 13 Chwefror 2008748 × 477 (16 KB)DemocracyATwork== Summary == {{Information |Description='''English:''' Ukrainian parliamentary election, 2007 sorted to better correlate to data table. |Source=Self-made based off [[:Image:Wahlkreise ukraine 2006 eng.png|ma
14:36, 6 Chwefror 2008Bawdlun y fersiwn am 14:36, 6 Chwefror 2008748 × 477 (19 KB)File Upload Bot (Magnus Manske) {{BotMoveToCommons|uk.wikipedia}} {{Information |Description={{uk|uk:?????????:?????????? 2007 http://www.cvk.gov.ua/pls/vnd2007/W6P320?PT001F01=600&pPlace=1 http://www.cvk.gov.ua/pls/vnd2007/W6P320?PT001F01=600&pPlace=2 http://www.c

Mae'r 1 tudalennau a ddefnyddir isod yn cysylltu i'r ddelwedd hon:

Defnydd cydwici y ffeil

Mae'r wicis eraill hyn yn defnyddio'r ffeil hon: